
Real-time forecasts of Solar Energetic Proton Events
|
|
Real-time forecasts of Solar Energetic Proton Events
|
Real-time forecasts of SEP events with energies greater than 100 MeV (top image) and 10 MeV (bottom image).
These images show the recent and the predicted integral proton flux. The current flux datum is indicated below the label "now". To the right of this label, the forecasted integral proton flux is presented. Colors indicate the intensity of the predicted integral proton flux for energies greater than 100 MeV (top image), described in Nunez (2015), and 10 MeV (bottom image), described in Núñez (2011).
Detailed forecasts:
|
|
|
|
|
Detailed real-time forecast of Solar Energetic Proton events with energies > 100 MeV |
Detailed real-time forecast of Solar Energetic Proton events with energies > 10 MeV |
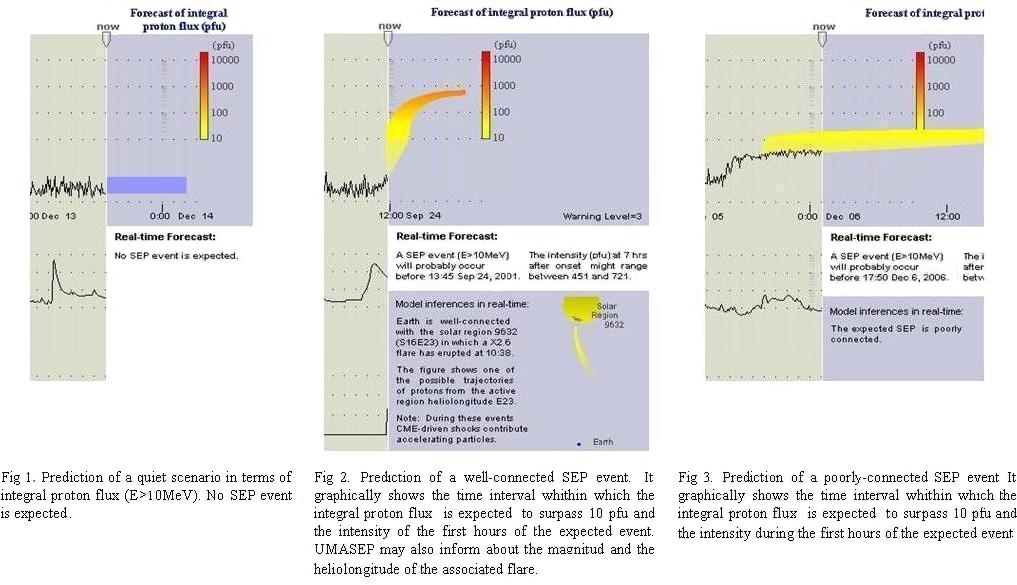
In addition to showing the plot of the integral proton flux (E > 100 MeV and E > 10 MeV), the detailed forecasts show the recent X-ray flux, the estimated magnetic connnectivity, and, for the case of well-connected SEP events, the intensity and time of the associated flare, and the helilongitude of the associated solar region (click to enlarge).
Summary of the UMASEP v1.2 forecaster
UMASEP analyzes soft X-ray, diferential and integral proton flux data in order to recognize precursors of three different proton flux situations: well-connected SEP events, poorly-connected SEP events, and "all-clear" situations. The figures below show forecast images generated by UMASEP after processing historical data: the first image at the left shows a forecast of an "all-clear" situation, indicated with a blue band, for December 13, 2001 (note that a very intense X5 flare occurred before the forecast); the second image shows a forecast of a well-connected SEP event (September 24, 2001); and, the image at the right shows a forecast of a poorly-connected SEP event (December 6, 2006).
UMASEP's real-time forecasts may also be consulted through the NASA's space weather system, called iSWA (see here). iSWA periocally stores the above forecast images several times per hour, therefore historic UMASEP forecasts (since January, 2010) may be consulted there. UMASEP forecasts may also be consulted in real-time in the European Space Weather Portal (see here). For more information about UMASEP, see [Núñez, M. 2011]. A summary of the performance of this forecaster with historical data (Cycles 22 and 23) is presented here.
References:
Núñez, M. (2011), Predicting solar energetic proton events (E > 10 MeV), Space Weather, 9, S07003, doi:10.1029/2010SW000640. Preprint (PDF)
Contact:
Prof. Dr. Marlon Núñez (Universidad de Málaga, Spain)
