Forecasting Solar Energetic Proton events (E > 10 MeV)
|
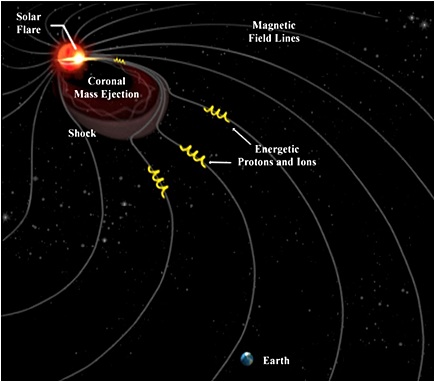
A Solar proton event occurs when protons emitted
by the Sun become accelerated to very high energies during a solar
flare accompanied by a coronal mass ejection or in interplanetary
space by the shocks associated with coronal mass ejections. Protons
are finally guided by the interplanetary magnetic field lines. Depending upon the observer’s longitude relative to the originating solar event, several intensity profiles that range from magnetically well-connected to poorly-connected solar energetic proton (SEP) events are possible [Reames, 2004]: |
|
|
|
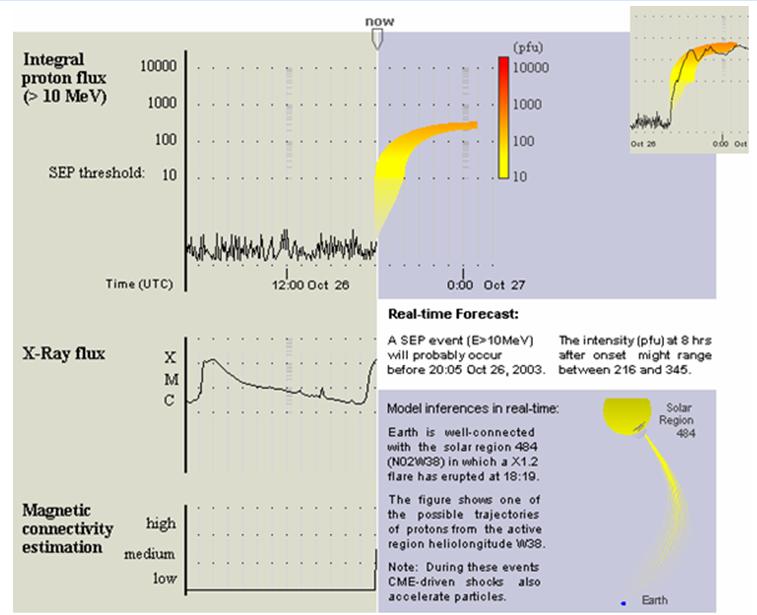
The UMASEP forecaster UMASEP [Núñez, 2011] is a system that forecasts SEP events (E>10 MeV) in real-time. This system is based on a dual-model approach for predicting the time interval within which the integral proton flux is expected to meet or surpass the Space Weather Prediction Center threshold of J (E >10 MeV) = 10 pr cm-2 sr-1 s-1 and the intensity of the first hours of well- and poorly-connected SEP events. The purpose of the first model is to identify precursors of well-connected events by empirically estimating the magnetic connectivity from the associated CME/flare process zone to the near-Earth environment and identifying the flare temporally associated with the phenomenon. This model analyzes flare and near-Earth space environment data (soft X-ray, differential and integral proton fluxes). The goal of the second model is to identify precursors of poorly-connected events by using a regression model that checks whether the differential proton flux behavior is similar to that in the beginning phases of previous historically poorly-connected SEP events, and thus deduce similar consequences. An additional module applies a higher-level analysis for inferring additional information about the situation, by filtering out inconsistent preliminary forecasts and estimating the intensity of the first hours of the predicted SEP events. The high-level module periodically retrieves solar data and, in the case of well-connected events, automatically identifies the associated flare and active region. Real-time UMASEP forecasts are publicly presented in three space weather sites: NASA's iSWA system [Madox et al 2008], European Space Weather Portal, and UMASEP forecast panel. These forecasts may also be consulted by ftp or by using the SOAP Web Service UMASEPForecasterService.
The graphical output of the UMASEP Forecaster is updated
automatically in the forecast panel
(http://spaceweather.uma.es/forecastpanel.htm).
Figure 3 shows the forecast panel that an operator would have seen
if the current UMASEP Forecaster had processed the real-time GOES
data during Oct 26th, 2003. This figure also shows inferences about
the associated flare, heliolongitude and active region, as well as a
small illustration of a possible route of the solar protons from the
corresponding heliolongitude toward the near-Earth environment.
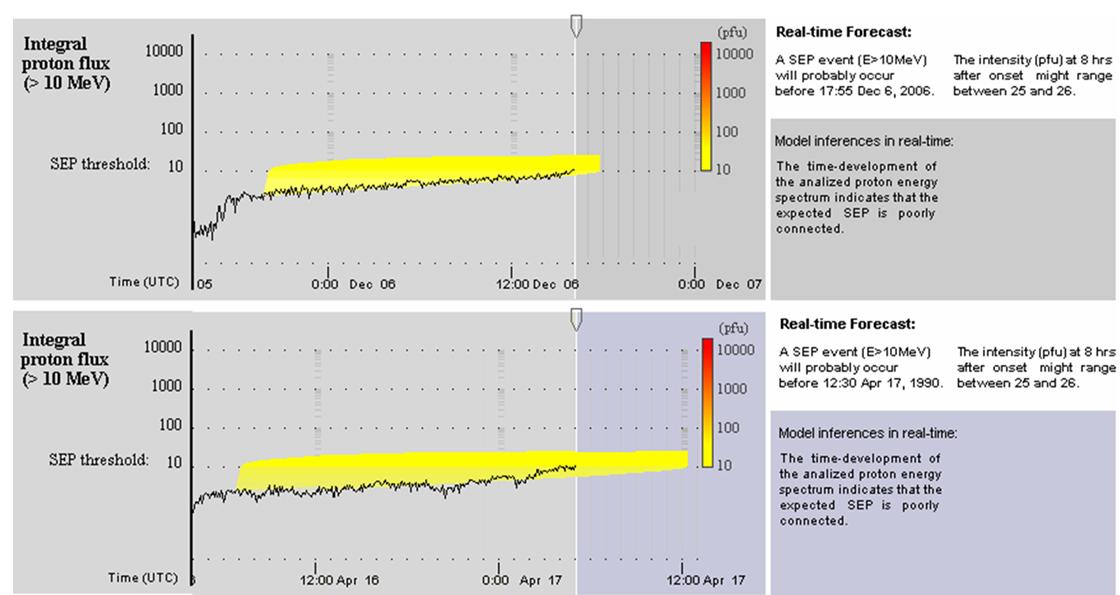
Fig. 3. This figure shows several
successful
forecasts of poorly-connected SEP events. This figure shows the
forecast of two SEPs during December 7th, 2006 (upper chart) and
April 16th, 1990 (lower chart). The respective anticipation times
were 20:05 hours and 22:05 hours. Validation results For the SEP events from January 1994 until June, 2013, of the NOAA/SWPC SEP list, the UMASEP v1.2 has a probability of detection (POD) of all well- and poorly-connected events of 86% (104/121) and a false alarm rate (FAR) of 21.8% (29/133)1, which outperforms current automatic forecasters in predicting >10 MeV SEP events. The presented forecaster has an average warning time (AWT) of 4 h 1 min for the successfully predicted events, 1 h 6 min for well-connected events and 8 h 9 min for poorly connected events, with a maximum warning time of 24 h for very gradual SEP events. ____
1 Note: For the SEP events before 1994,
the GOES satelite's X-ray and proton observations included periods
of high noise and data gaps, which increments the number of UMASEP's
false alarms. Since the GOES satelite's data quality has improved,
the UMASEP's validation results for those early years are not
representative of current situations. Maybe for this reason, the
validation of the recent SEP forecasters do not include GOES's
data before 1994. Just for information purposes, we inform that for
the period 1986-2013 the POD of UMASEP is 82.72% (158/191), the FAR
is 31.3%, (72/230), and an AWT is 4 h 49 min. References
Maddox, M., M. Hesse, M. Kuznetsova, M. Rastaetter, L. MacNeice,
P.
J. Jain, W. Garneau, D.H. Berrios, A. Pulkinnen, and D. Rowland
(2008), The Integrated Space Weather Analysis System, paper
presented at the American Geophysical Union Fall Meeting 2008,
Website: http://iswa.gsfc.nasa.gov/iswa/iSWA.html |
|